
Equity Market Trends: Q3 2026 Valuations & Capital Markets Update
October 9, 2026
Estimated reading time: 9 minutes
The article in brief:
- Strong corporate earnings continue to support equity market valuations, but investors are increasingly focused on execution rather than multiple expansion. Record profitability and AI-driven productivity gains remain key drivers of market performance, while questions surrounding the durability of these trends continue to shape valuation discussions.
- Capital markets remain supportive despite higher interest rate expectations. Public equity markets reached new highs during the quarter, financing conditions remained constructive, and private equity exits improved relative to recent years, though market activity remains below peak levels and investor selectivity continues to increase.
- Valuation outcomes are becoming increasingly differentiated across sectors, company sizes, and asset classes. Large-cap public companies continue to command valuation premiums, while smaller companies, lower-middle-market transactions, and leverage-sensitive businesses face a more selective operating and financing environment.
Corporate Profitability Remains a Key Market Debate
Corporate profitability remains one of the most important drivers of equity market performance and valuation levels. Despite inflationary pressures, elevated interest rates, moderating economic growth, and ongoing geopolitical uncertainty, U.S. corporate earnings have remained exceptionally strong, helping support elevated market valuations. According to data from the U.S. Bureau of Economic Analysis, after-tax corporate profits reached a record 13.91% of gross domestic product (GDP) in the second quarter of 2026, representing the highest reading in data extending back to 1947.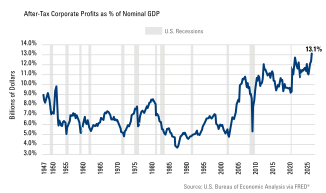
Aggregate U.S. corporate profits have more than doubled since 2020. Unlike prior market cycles, profit growth has remained persistent, challenging traditional expectations that elevated earnings eventually mean revert toward historical averages and place downward pressure on valuation multiples.
Several structural factors continue to support profitability:
- Asset-Light Scalability. Software, digital platforms, and intellectual-property-intensive businesses can scale revenue significantly faster than overhead costs, creating substantial operating leverage.
- Technology, Automation, and AI. Advances in automation, data analytics, and artificial intelligence continue to improve productivity and operational efficiency, helping offset inflationary and labor-related cost pressures.
- Market Concentration. Large-cap market leaders continue to benefit from scale, pricing power, and competitive barriers that support historically strong operating margins.
In fact, some of the industries with the largest contributions to after-tax profit growth between late 2019 (prior to the pandemic) and the second quarter of 2026 include information, as well as computer and electronic components.1
These trends have become increasingly important for valuation professionals because continued earnings growth has helped offset concerns surrounding elevated market multiples. Reflecting these structural tailwinds, market analysts expect S&P 500 earnings to increase approximately 29.5% year-over-year in the third quarter of 2026. If achieved, it would mark the third consecutive quarter of earnings growth exceeding 25%.
According to FactSet, robust earnings growth has also contributed to a decline in the S&P 500 forward 12-month price-to-earnings ratio, which has fallen from 20.4x (at the end of Q2 2026) to 19.1x at the end of September. As a result, the market currently trades near its 10-year average forward multiple of 19.1x despite equity indices remaining near record highs.
The central question for equity investors and valuation professionals is whether current profitability levels can be sustained over the longer term to justify multiples. Optimists argue that continued advances in AI and automation will permanently enhance productivity and corporate earnings power. More cautious observers note that periods of peak profitability have historically attracted increased competition and, over time, resulted in lower returns on incremental capital. As mega-cap corporations continue investing heavily in AI infrastructure and related technologies, the ultimate return on those investments remains uncertain.
These competing perspectives help explain much of the market’s recent behavior. Strong earnings continue to support stock prices and equity market valuations, while investors simultaneously evaluate broader risks, including slowing economic growth should enthusiasm surrounding the AI investment theme fade, persistent fiscal deficits, and the long-term return profile of large-scale AI investments.
Ultimately, record profitability places greater emphasis on operational execution as a driver of future equity returns. If current valuation levels are to remain supported, companies will need to demonstrate that recent productivity gains can translate into durable earnings growth and sustainable margins as AI-related investment spending continues to expand. Until that process becomes clearer, earnings growth rather than multiple expansion may remain the primary driver of market performance.
Public Market Performance and Valuation Multiple Trends
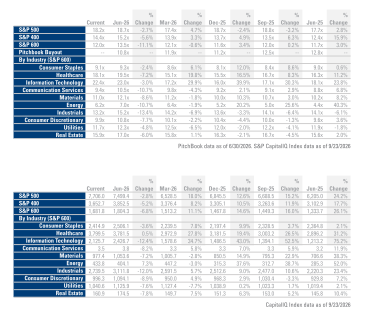 Equity markets continued to advance during the third quarter of 2026, although performance became increasingly concentrated among larger capitalization companies. Since June 30, 2026, the S&P 500 gained approximately 3%, reaching new highs and extending its strong year-to-date performance. In contrast, the S&P MidCap 400 and SmallCap 600 declined approximately 5% and 7%, respectively, reflecting a more cautious investor stance toward smaller companies amid ongoing economic and financing uncertainties.
Market performance remained supported by resilient corporate earnings and continued confidence in long-term growth opportunities, although participation narrowed relative to the broader rally experienced earlier in the year. Despite ongoing geopolitical risks and commodity market volatility, investors generally favored larger, more established businesses with stronger earnings visibility, durable cash flows, and balance sheet strength, or those supporting the AI investment theme.
Sector performance became increasingly differentiated during the quarter. Energy was the strongest-performing sector, advancing approximately 7% as commodity prices stabilized and sentiment improved. U.S. oil companies are experiencing a significant increase in profits tied to the surge in prices of oil and related commodities, following supply disruptions linked to the Strait of Hormuz and Middle East conflict. Healthcare was relatively unchanged, supported by its defensive characteristics and stable earnings profile. In contrast, Information Technology and Industrials each declined approximately 12% as investors took profits following strong prior performance and some concerns about the sustainability of the AI investment boom, with valuation multiples moderating from elevated levels.
Despite the recent pullback, Information Technology remains among the strongest-performing sectors over longer periods, advancing nearly 35% since March 2026 and more than 75% since September 2025. The sector continues to benefit from ongoing investment in artificial intelligence, digital infrastructure, and technology-enabled productivity initiatives.
Valuation multiples generally contracted during the quarter as earnings growth outpaced share price appreciation and investors adopted a more measured approach toward risk assets. The S&P 500 multiple declined to approximately 18.2x from 18.7x at June quarter-end, while the S&P 400 and S&P 600 decreased to 14.4x and 12.0x, respectively.
Sector valuations also moved modestly lower. Information Technology declined to 22.4x from 23.0x, while Industrials decreased to 13.2x from 15.2x. Energy multiples contracted to 6.2x from 7.0x despite positive share-price performance, reflecting stronger earnings expectations. Healthcare multiples declined to 18.1x from 19.5x but remained above broader market averages.
Private equity buyout multiples also moderated, declining to approximately 10.8x according to PitchBook data. While the gap between public and private market valuations narrowed modestly during the quarter, public market multiples continue to reflect a premium for liquidity, scale, and long-term growth prospects.
For private market investors, the current environment remains mixed but increasingly constructive. Strong public market valuations and sustained large-cap equity performance continue to support potential exit opportunities for businesses with durable growth profiles and clear paths to value creation. At the same time, weakness among smaller capitalization companies and recent multiple compression suggest investors are increasingly focused on earnings quality, balance sheet strength, and operational execution rather than relying on multiple expansion alone.
Public vs. Private Market EV/EBITDA
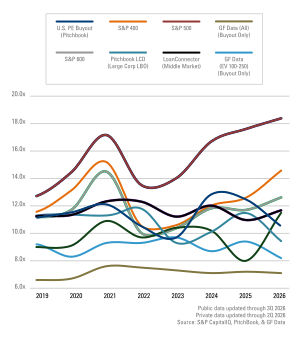 While quarterly valuation multiples moderated across major market indices, longer-term valuation trends continue to illustrate a meaningful divergence between public and private markets.
- S&P 500 EV/EBITDA multiples increased from 16.7x in 2024 to 17.6x in 2025 and reached approximately 18.4x during 2026, approaching historic highs recorded earlier this year.
- Smaller public companies, represented by the S&P 600, traded at approximately 12.6x EV/EBITDA in 2026 compared with 11.7x in 2025, although they remain significantly below large-cap valuation levels.
- Private market multiples expanded more gradually, with median EV/EBITDA increasing to approximately 12.0x through June 2026 compared with 11.5x in 2025.
- Within private markets, transaction multiples continue to vary by size cohort. GF Data reported multiples declining from 9.6x to 8.3x within the $100 million to $250 million enterprise value segment, while multiples increased from 9.6x to 10.7x for transactions between $250 million and $500 million.
- Across both public and private markets, smaller companies continue to trade at a discount to larger peers, reflecting differences in scale, liquidity, financing access, and investor demand.
Cost of Capital Update: Debt Markets, Equity Risk Premiums, and SOFR Outlook
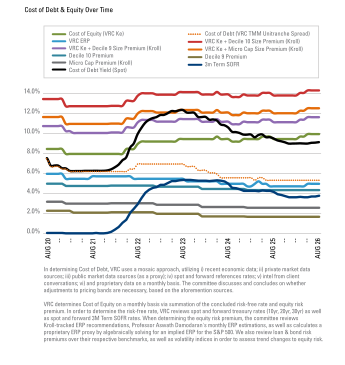 Financing conditions remained relatively stable during the third quarter despite a recent pivot in monetary policy toward tightening, and continued uncertainty surrounding inflation and economic growth. Average debt yields remained near 9.5%, consistent with the normalization trend that has emerged across credit markets since borrowing costs peaked above 12% in 2023.
Three-month SOFR increased to 4.08% at the end of September 2026, approximately 35 basis points higher than second-quarter levels, following the Federal Reserve’s most recent rate increase. Markets currently anticipate at least one additional rate hike before year-end, with further increases possible in the first half of 2027, reinforcing expectations that interest rates may remain elevated longer than previously anticipated.
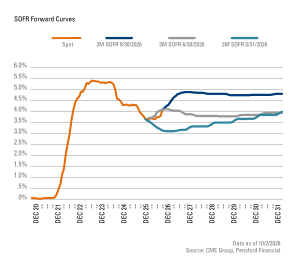 The SOFR forward curve experienced notable volatility throughout the quarter as investors adjusted expectations for future monetary policy. Recent pricing suggests market participants have shifted expectations toward near-term rate hikes and are now assigning greater probability to a prolonged higher-for-longer environment. VRC explores these developments in greater detail in our U.S. Macroeconomic & Interest Rate Trends: Q3 2026 market update.
The most significant change during the quarter occurred within the cost of equity. VRC’s estimated cost of equity, calculated as the sum of the risk-free rate and equity risk premium, increased 25 basis points to 10.25% and now stands approximately 75 basis points above year-end 2025 levels.
The increase was driven primarily by higher risk-free rates and upward revisions to long-term interest rate expectations, while equity risk premium assumptions remained relatively stable at approximately 5.0%. Notably, this increase in required returns occurred alongside strong public equity market performance and elevated valuation levels, reflecting continued confidence in future earnings growth despite a higher cost of capital framework.
Overall, capital markets remain supportive. Nevertheless, increasing Fed policy rates and required returns highlight the importance of disciplined valuation analyses and realistic long-term growth assumptions as market participants navigate a higher-for-longer interest rate environment.
Private Equity Exits and Fundraising Activity
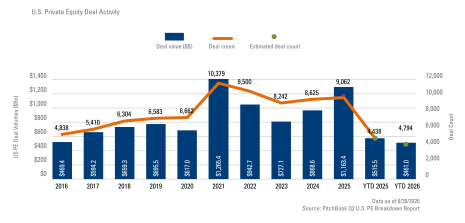 Private equity activity continued to show signs of recovery during 2026, although conditions remain uneven across market segments.
In the first half of 2026, total U.S. private equity exit activity reached approximately $461.0 billion across an estimated 4,764 transactions. While both exit value and transaction volume moderated relative to the exceptionally strong fourth quarter of 2025, activity remains above most quarterly levels observed throughout 2022, 2023, and 2024.
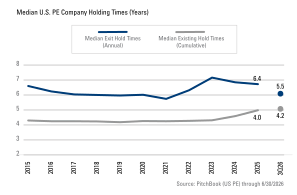 Execution conditions continue to benefit from strong public equity markets and resilient credit markets. While sponsors remain disciplined on pricing and transaction structures, demand for high-quality businesses with durable cash flows and attractive growth profiles remains healthy.
Holding period trends suggest liquidity conditions have gradually improved. Median exit holding periods declined to approximately 5.5 years in 2026 from 6.4 years in 2025, indicating sponsors have become increasingly capable of bringing mature portfolio companies to market. However, median holding periods for portfolio companies still owned by sponsors increased modestly to 4.2 years, suggesting a significant inventory of seasoned assets remains within the private equity ecosystem.
The recent increase in interest rate expectations may slow further progress. While market conditions have improved relative to the past several years, higher financing costs could place renewed pressure on exit timelines as buyers and sellers adjust to evolving capital market conditions.
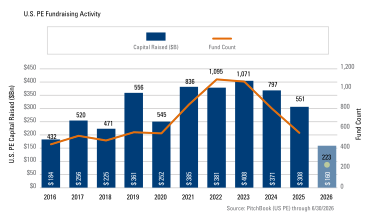 Fundraising activity remained solid through the first half of 2026. Approximately $159.6 billion of capital was raised across 223 funds. Although fundraising activity remains below the peak levels achieved between 2021 and 2023, substantial dry powder continues to support investment activity throughout the industry.
The decline in fund count highlights an increasingly concentrated fundraising environment. Larger, established managers continue to attract capital, while emerging and middle-market sponsors face a more competitive landscape. Incremental improvements in distributions and exit activity may gradually improve fundraising conditions across broader segments of the market.
Additional Private Equity Market Observations
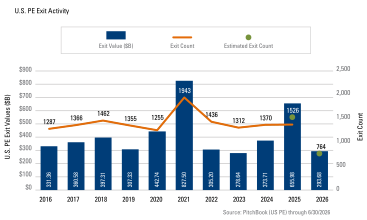 U.S. private equity deal activity totaled approximately $461 billion through the first half of 2026, representing a pace roughly 11% below the comparable 2025 period.
- Despite lower overall market activity, VRC transaction observations indicate improving middle-market deal flow and M&A pipelines following first-quarter volatility.
- Stronger public equity markets, improved tariff visibility, meaningful private equity and private credit dry powder, and pressure to monetize long-held assets continue to support transaction activity.
- Exit activity remains below 2025 levels and may remain constrained by macroeconomic uncertainty and higher financing costs through the balance of 2026.
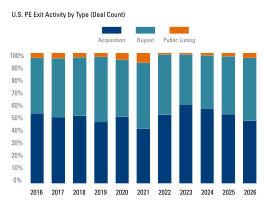 IPO markets remain relatively subdued for private equity sponsors, representing approximately 17.3% of exit value and 3.6% of exit count during the first half of 2026, both below 2025 levels.
Leverage Trends and Credit Market Conditions
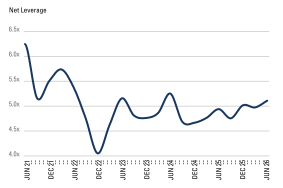 Based on VRC proprietary data, median net leverage (xEBITDA) for new deals increased modestly during the quarter to approximately 5.1x, up from 5.0x in the prior quarter and continuing a gradual recovery from the mid-4x levels observed during late 2024.
While leverage remains below the post-pandemic peak above 6.0x observed during 2021 and early 2022, it has remained within a relatively stable range of approximately 4.6x to 5.2x throughout the past three years.
Overall, leverage trends continue to suggest a market characterized by stability rather than aggressive expansion. Future leverage levels will likely depend on the pace of transaction activity, lender competition, and the evolution of interest-rate expectations as markets move into 2027. Additional perspective on middle-market leverage, credit stress, and default trends is available in VRC’s Private Market Trends: Q3 2026 Private Credit & Equity Update.
Economic & Interest Rate Environment
Macroeconomic conditions remained an important driver of equity market performance during the third quarter. Markets continued to balance resilient economic growth against renewed inflation concerns, higher interest rates, and ongoing geopolitical uncertainty. Recent Federal Reserve actions reinforced expectations for a higher-for-longer rate environment, while rising Treasury yields continued to influence investor sentiment and capital market activity.
These developments have direct implications for valuation professionals, influencing discount rates, cost of capital assumptions, risk premiums, and investor return expectations. Additional perspective on inflation, Federal Reserve policy, Treasury yields, labor market conditions, and the broader economic outlook is available in VRC’s U.S. Macroeconomic & Interest Rate Trends: Q3 2026 market update.
1 Source: Bureau of Economic Analysis. Another large contributor to Q2 2026 corporate profits comes from petroleum and coal products, reflecting the surge in global oil prices after the Iran conflict began. However, this source of profit growth is unlikely to persist, assuming some sort of resolution in the Middle East conflict.
Explore the Full Market Commentary Series

U.S. Macroeconomic & Interest Rate Trends: Q3 2026
U.S. markets are increasingly balancing resilient economic fundamentals against renewed inflation pressures, rising interest rates, and growing geopolitical uncertainty.

Private Market Trends: Q3 2026 Private Equity Credit Update
Private credit remains a story of divergence: while refinancing pressure and restructuring activity continue to build among older loan vintages, improving deal activity and substantial private capital dry powder are creating renewed momentum across the market.

Structured Products Market Trends: Q3 2026 CLO & ABS Update
Resilient demand and favorable liability management opportunities continued to support CLO and ABS markets through the third quarter, although collateral quality, credit dispersion, and borrower-specific risks increasingly differentiated outcomes across sectors and capital structures.

European Private Market Trends: Q2 2026 Direct Lending & Private Equity Update
European private markets stabilized during the second quarter of 2026, but investor selectivity continues to increase as lenders and sponsors navigate AI disruption, geopolitical uncertainty, and a challenging exit environment.