
Equity Market Trends: Q2 2026 Valuations & Capital Markets Update
Estimated reading time: 7 minutes
The article in brief:
- Scale continues to shape private equity markets. Capital deployment remains concentrated in larger transactions, while sponsors broaden their focus beyond technology into a wider range of industries.
- Public market momentum returned in the second quarter. Equity indices recovered strongly from first-quarter weakness, supporting valuation multiple expansion and improving conditions for potential exits.
- Cost of capital remains an important valuation consideration. Although credit markets remained stable, increased long-term rate expectations contributed to higher required returns across the market.
Private Equity Deal Activity Trends: Scale, Sector Rotation, and Market Concentration
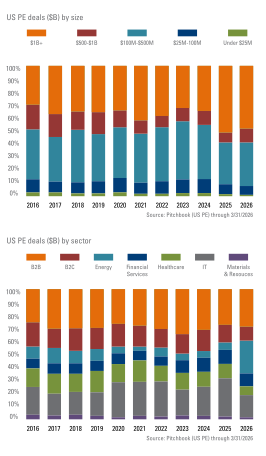 Private equity deal activity in 2026 continues to reflect increasing concentration in larger transactions. While overall deal volume remains below levels reached during the post-pandemic cycle, capital deployment has become increasingly focused on a relatively small number of large-scale acquisitions. According to PitchBook data, through the first quarter of 2026, transactions exceeding $1 billion represented approximately 48% of total U.S. private equity deal value, compared with 34% in 2024 and near the record 51% observed in 2025. Transactions between $100 million and $500 million accounted for an additional 35% of deal value, leaving a smaller share of capital allocated to lower middle-market transactions.
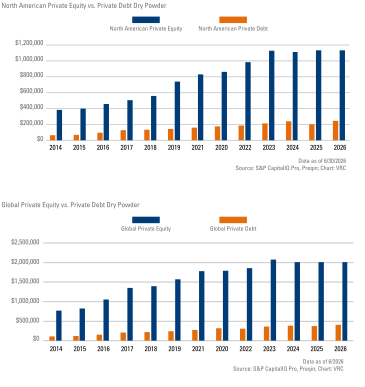
Several factors appear to be supporting this trend. Financing markets have stabilized considerably from the disruption experienced during 2022 and 2023, giving sponsors greater confidence when evaluating larger transactions. Public equity market performance has also improved valuation support and expanded potential exit alternatives. At the same time, private equity firms continue to manage significant levels of dry powder, making large platform acquisitions an efficient means of deploying capital at scale.
Sector allocation shifted meaningfully during the quarter. Technology and IT represented approximately 17% of deal value through March, down from nearly 29% during 2025. Energy accounted for approximately 25% of deal value, up substantially from roughly 6% in 2025, becoming one of the largest sectors by share. Business-to-business services remained a significant component of deal activity at approximately 29%, while healthcare and financial services maintained stable participation levels.
This change in sector composition suggests that sponsors are broadening their focus beyond the technology-centered themes that drove much of the activity in recent years. Capital deployment increasingly reflects interest in industries supported by infrastructure investment, energy demand, established cash-flow generation, and long-term demand.
A notable example of continued concentration in mega-transactions was the acquisition of xAI by SpaceX. While not a traditional private equity transaction, the reported $250 billion valuation illustrates the substantial amount of capital currently being directed toward a relatively small number of scaled businesses operating at the intersection of AI, data infrastructure, and digital platforms.
 For private equity investors and valuation professionals, these trends highlight two important developments. First, improved financing conditions continue to support larger transactions. Second, sector-level capital allocation is becoming more diversified, suggesting sponsors are evaluating opportunities across a broader range of industries rather than concentrating exclusively on the dominant themes of the previous cycle.
Overall, the first quarter of 2026 points to a private equity market that remains active but increasingly concentrated. Capital is flowing toward larger transactions and a broader set of industries, reflecting an ongoing shift beyond the narrow technology leadership that characterized much of the recent cycle. Whether this trend continues will depend on financing conditions, exit activity, and the availability of attractive investment opportunities. As the market evolves, scale, sector selection, and disciplined execution are becoming increasingly important considerations for sponsors deploying capital.
Public Market Performance and Valuation Multiple Trends
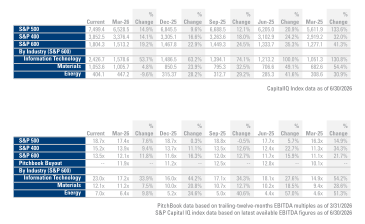 Equity markets rebounded sharply during the second quarter of 2026, recovering from the pullback experienced earlier in the year and pushing major indices to new highs. Since March 31, the S&P 500 advanced approximately 15%, while the S&P MidCap 400 and S&P SmallCap 600 gained approximately 14% and 19%, respectively. Importantly, since the beginning of the Middle East conflict on February 28, the S&P 500 has risen by approximately 18%, while the tech-focused NASDAQ climbed 25%. The recovery reflects improving market sentiment, resilient earnings growth results and expectations, and reduced concerns surrounding near-term economic growth risks stemming from the Middle East conflict.
Performance leadership remained concentrated in growth-oriented sectors. Within the S&P Small Cap 600 Index, Information Technology gained approximately 54% since March and more than 63% year-to-date. Continued investment in AI, digital infrastructure, and technology-enabled productivity solutions supported the sector’s performance. Materials produced more modest gains of 5%, while Energy declined roughly 10% as commodity prices softened and investors rotated toward higher-growth opportunities.
Participation broadened across market capitalizations during the quarter. Mid-cap and small-cap equities generally performed in line with large-cap benchmarks, suggesting the recovery was not limited exclusively to the largest technology companies.
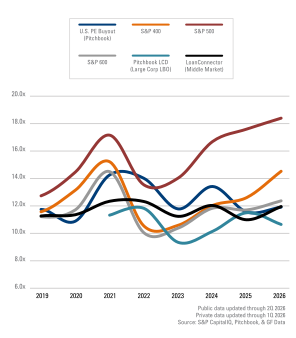 Valuation multiples expanded alongside improving market performance. The S&P 500 EBITDA multiple increased to approximately 18.7x from 17.4x at the end of the first quarter. The S&P 400 and S&P 600 EBITDA multiples expanded to approximately 15.2x and 13.5x, respectively. Technology experienced the most significant re-rating, with EBITDA multiples increasing to approximately 23.0x from 17.2x just three months earlier.
In contrast, private equity buyout multiples remain below comparable public market valuations. According to the latest PitchBook data, buyout multiples remain near 11.9x. The valuation differential continues to reflect factors such as liquidity, scale, investor sentiment, and differing transaction dynamics between public and private markets.
For private market participants, the current environment presents both opportunities and considerations. Strong public market performance may support transaction activity and exit conditions for high-quality, growth-oriented businesses. At the same time, elevated public market valuations reinforce the importance of disciplined underwriting assumptions, realistic growth expectations, selective capital deployment, and thoughtful valuation analyses.
While financing conditions and exit timing remain important considerations for private equity sponsors, the improving public market backdrop may create a more constructive environment for value realization during the second half of 2026.
Cost of Capital Update: Debt Markets, Equity Risk Premiums, and SOFR Outlook
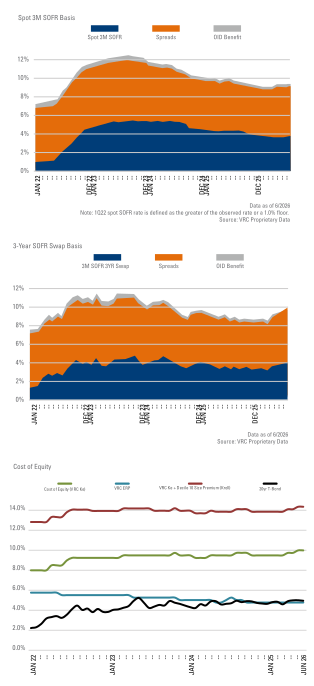 In determining Cost of Debt, VRC uses a mosaic approach, using i) recent economic data; ii) private market data sources; iii) public market data sources (as a proxy); iv) spot and forward references rates; v) intel from client conversations; vi) and proprietary monthly data. The committee discusses and concludes whether adjustments to pricing bands are necessary, based on the aforementioned sources.
Monthly, VRC determines the base market Cost of Equity via the summation of the risk-free rate and the equity risk premium. To determine the longer-term risk-free rate, VRC reviews spot and forward treasury rates (10-year, 20-year, 30-year) as well as spot and forward 3M Term SOFR rates. When determining the equity risk premium (ERP), the committee reviews Kroll ERP recommendations, Professor Aswath Damodaran’s monthly ERP estimations, and calculates a proprietary ERP proxy by algebraically solving for an implied ERP for the S&P 500. We also review loan and bond risk premiums over their respective benchmarks, as well as volatility indices, to assess changes in trend for equity risk.
Financing conditions remained relatively stable during the second quarter despite continued uncertainty surrounding inflation, monetary policy, and global economic developments. Average debt yields remained near 9%, consistent with the normalization trend observed across credit markets since borrowing costs peaked above 12% during 2023.
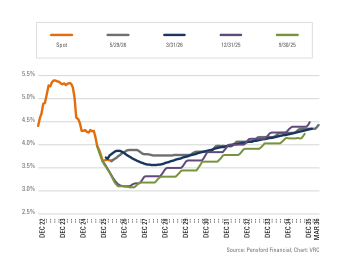 Three-month SOFR remained largely unchanged at approximately 3.68%, while VRC’s spot cost of debt yield was effectively flat at 9.05% as of June 30, compared with 9.06% at March 31. The stable financing environment continued to support transaction activity and capital deployment across private markets, but on a more selective basis.
The SOFR forward curve continues to indicate the potential for modest declines in short-term rates before stabilizing over longer horizons in the mid-4% range. Relative to prior quarters, however, forward rate expectations moved slightly higher, reflecting growing expectations that interest rates may remain elevated for longer than previously anticipated.
This view was reinforced by the Federal Reserve’s June meeting, during which policymakers maintained current benchmark rates and indicated a more hawkish stance, with a focus on achieving price stability and the Fed’s 2.0% inflation target. Market participants have abandoned expectations for near-term rate cuts, and future markets now pricing one to two rate hikes for 2026.
The most notable change during the quarter occurred within the cost of equity. VRC’s cost of equity, calculated as the sum of the risk-free rate and ERP, increased by 25 basis points during the quarter to 10.0% and is now 50 basis points above year-end 2025 levels. The increase during the quarter was driven by higher risk-free rate assumptions, due to upward revisions to longer-term interest rate expectations. In the first quarter of 2026, VRC’s view on the ERP had increased from 4.75% to 5.0% relative to year-end 2025, reflecting uncertainties surrounding the onset of the Middle East conflict. However, equity risks have stabilized since the beginning of the conflict, and VRC’s view on the ERP has remained around 5.0%.
This increase in required returns occurred alongside a significant rebound in public equity markets and meaningful valuation multiple expansion, particularly within technology-oriented sectors. Together, these developments suggest that investors remain confident in future earnings growth, even as required returns and broader risk premiums remain above levels observed at the beginning of the year.
Overall, capital markets remained constructive during the quarter. Stable debt financing conditions, resilient credit markets, and stronger public equity performance contributed to an improving backdrop for transaction activity and potential exit opportunities. At the same time, higher required equity returns reinforce the importance of disciplined valuation assumptions and careful assessment of long-term growth expectations.
Private Equity Exits and Fundraising Activity
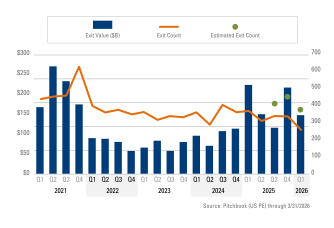 U.S. private equity exit activity remained resilient during the first quarter of 2026, extending the recovery that emerged throughout 2025. Including estimated transactions, total exit activity reached approximately $144.4 billion across 373 transactions during the quarter.
While both exit value and transaction volume moderated from the exceptionally strong fourth quarter of 2025, activity remained above many of the quarterly levels recorded during 2022, 2023, and 2024. The continued pace of exits reflects improved market confidence, greater financing stability, and sustained buyer interest in high-quality assets.
Execution conditions continue to benefit from stronger public equity markets, more stable credit conditions, and greater certainty around financing despite ongoing macroeconomic and geopolitical uncertainties. Although sponsors remain disciplined on valuation, pricing, and transaction structure, the market continues to absorb quality businesses with durable cash flows, attractive growth characteristics, and established competitive positions.
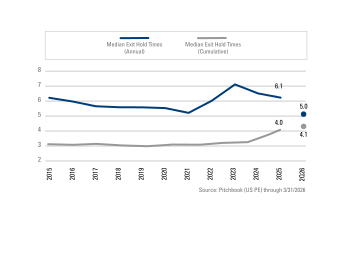 Holding-period data provides additional evidence that exit conditions are gradually improving. Median exit holding periods declined to approximately five years in 2026, compared with 6.1 years in 2025. This trend suggests sponsors are increasingly able to bring mature portfolio companies to market under more favorable conditions.
At the same time, median holding periods for existing portfolio companies increased to approximately 4.1 years from four years. This dynamic indicates many sponsors continue to pursue additional value-creation initiatives while evaluating the timing of future liquidity opportunities.
Together, these trends suggest that while exit and liquidity conditions have improved, a meaningful inventory of seasoned portfolio companies remains within private equity portfolios.
Fundraising activity continues to reflect a selective environment. Through the first quarter of 2026, approximately $54.2 billion was raised across 84 funds. Although fundraising activity remains below the elevated levels observed between 2021 and 2023, substantial dry powder continues to support industry-wide investment activity.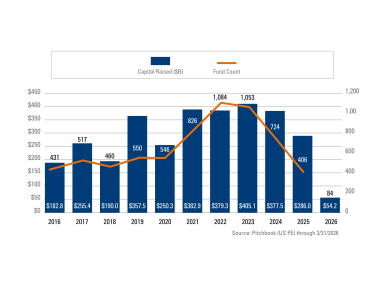
The decline in fund count highlights increasing concentration among larger, established managers with proven fundraising track records. Emerging and middle-market sponsors continue to face a more competitive fundraising environment as limited partners remain selective in their capital commitments.
As exit activity and distributions continue to improve, fundraising conditions may gradually broaden. However, the market remains characterized by disciplined capital allocation and strong competition for investor commitments.
Overall, exit activity continues to demonstrate gradual improvement, supported by more stable financing markets and stronger public equity performance. Fundraising conditions remain selective, while larger and more established sponsors continue to attract a significant share of investor capital. Together, these trends point to improving liquidity conditions within a private equity market that continues to operate with disciplined underwriting and fundraising standards.
Economic and Market Developments Affecting Valuations
U.S. Labor Market
The U.S. economy added 57,000 new jobs in June, which was lower than consensus estimates, while May jobs saw a downward revision from 172,000 to 129,000. Nevertheless, the labor market is still showing signs of resilience. After payroll revisions, job creation has averaged approximately 111,000 over the last three months. Meanwhile, the unemployment rate dropped to 4.2% in June from 4.3% in the previous month, continuing a relatively stable trend observed over the past year.
Wage growth moderated modestly but remained constructive. Average hourly earnings increased 0.3% in June and 3.5% on a year-over-year basis. Overall, the data suggests a labor market that continues to normalize while maintaining steady employment growth and relatively low unemployment levels by historical standards.
Inflation
Consumer prices increased 0.5% in May, accelerating from April and pushing year-on-year headline CPI inflation to approximately 4.2%. Energy prices accounted for a significant portion of the monthly increase, but core inflation still accelerated to 2.9% on a year-over-year basis (from 2.8% in April).
Producer prices surged during the month, increasing 1.1% in May and lifting the twelve-month trailing wholesale inflation to approximately 6.5%, the largest since November 2022.
Consensus expectations continue to suggest that inflation could moderate in coming months, particularly if energy prices stabilize. However, recent geopolitical developments have introduced additional uncertainty and increased upside risks to the inflation outlook.
Federal Reserve Outlook
The Federal Reserve maintained the federal funds rate within a target range of 3.50% to 3.75% during its June meeting, citing continued economic resilience and inflation that remains above the Fed’s 2.0% long-term target.
Following the meeting, policymakers communicated a bigger focus on bringing inflation down to the Fed’s target. Updated policy rate projections reflected a somewhat higher expected rate path, with several policymakers indicating that additional tightening could remain an option should inflation pressures persist.
Interest-rate futures markets have adjusted accordingly. Current expectations increasingly reflect a higher-for-longer interest-rate environment, with anticipated one to two hikes during 2026 and potential easing pushed further into future periods.
For valuation professionals, these developments remain important inputs when evaluating discount rates, cost of capital assumptions, financing conditions, and broader capital market trends.